Polar Studies Are Essential Tools For Facing The Biggest Challenge Of Our Times
SCIENCE
This article is a part of the series Listening to Polar Regions produced in media collaboration between JONAA and Global Geneva and published in both.
Writer: Dr. Paul Andrew Mayewski
Photographs: Kristjan Fridriksson, Ragnar Axelsson, Paul A. Mayewski
August 2018

Antarctica holds nearly two-thirds of the planet’s fresh water, bound in solid ice. To put that in a hypothetical perspective; were all that ice in the Antarctic and all the ice in the Arctic to melt, sea levels worldwide would rise by nearly 70 metres. That is how much freshwater is frozen on earth and that is why fighting the ongoing and fast melt of polar ice is the most important battle of our times. But, as Climate change specialist, polar explorer and scientist Dr. Paul Andrew Mayewski writes, we are rapidly endangering our very survival as a result of human industrialization’s impact on polar regions.
The polar regions were considered until only recently to be the most timeless, unchanging ends of the Earth. The common belief was that they had little relevance to the “civilized” world. Early European explorers created maps followed for centuries by hunting for seals, whales and other marine life. However, Arctic native peoples were among the few who learned to not only survive, but to thrive in the Arctic and, of course, there were no humans occupying the Antarctic.
As someone who has led many expeditions throughout Antarctica, Greenland, and numerous other high and cold places, I consider myself truly privileged for the opportunity to experience these environments. Standing on the high plateau in the centre of Antarctica, thousands of kilometres from civilization, I have been able to view, through the crystal-clear air, the curvature of the Earth, to breathe in the cleanest air on the planet, to drink Earth’s purest water (albeit after melting it in a tent in the midst of temperatures as low as -50˚C), and, when the wind stops, to hear my heart beat in my ears because there is no other noise. I have also felt the cold biting wind seem to pass right through me as we ascended the last mountain before the South Pole, and spent many days tent-bound, waiting for storms to pass, surrounded by a world of swirling snow where companions’ voices can barely be heard and depth perception is replaced by just whiteness. But this white world is fast changing.

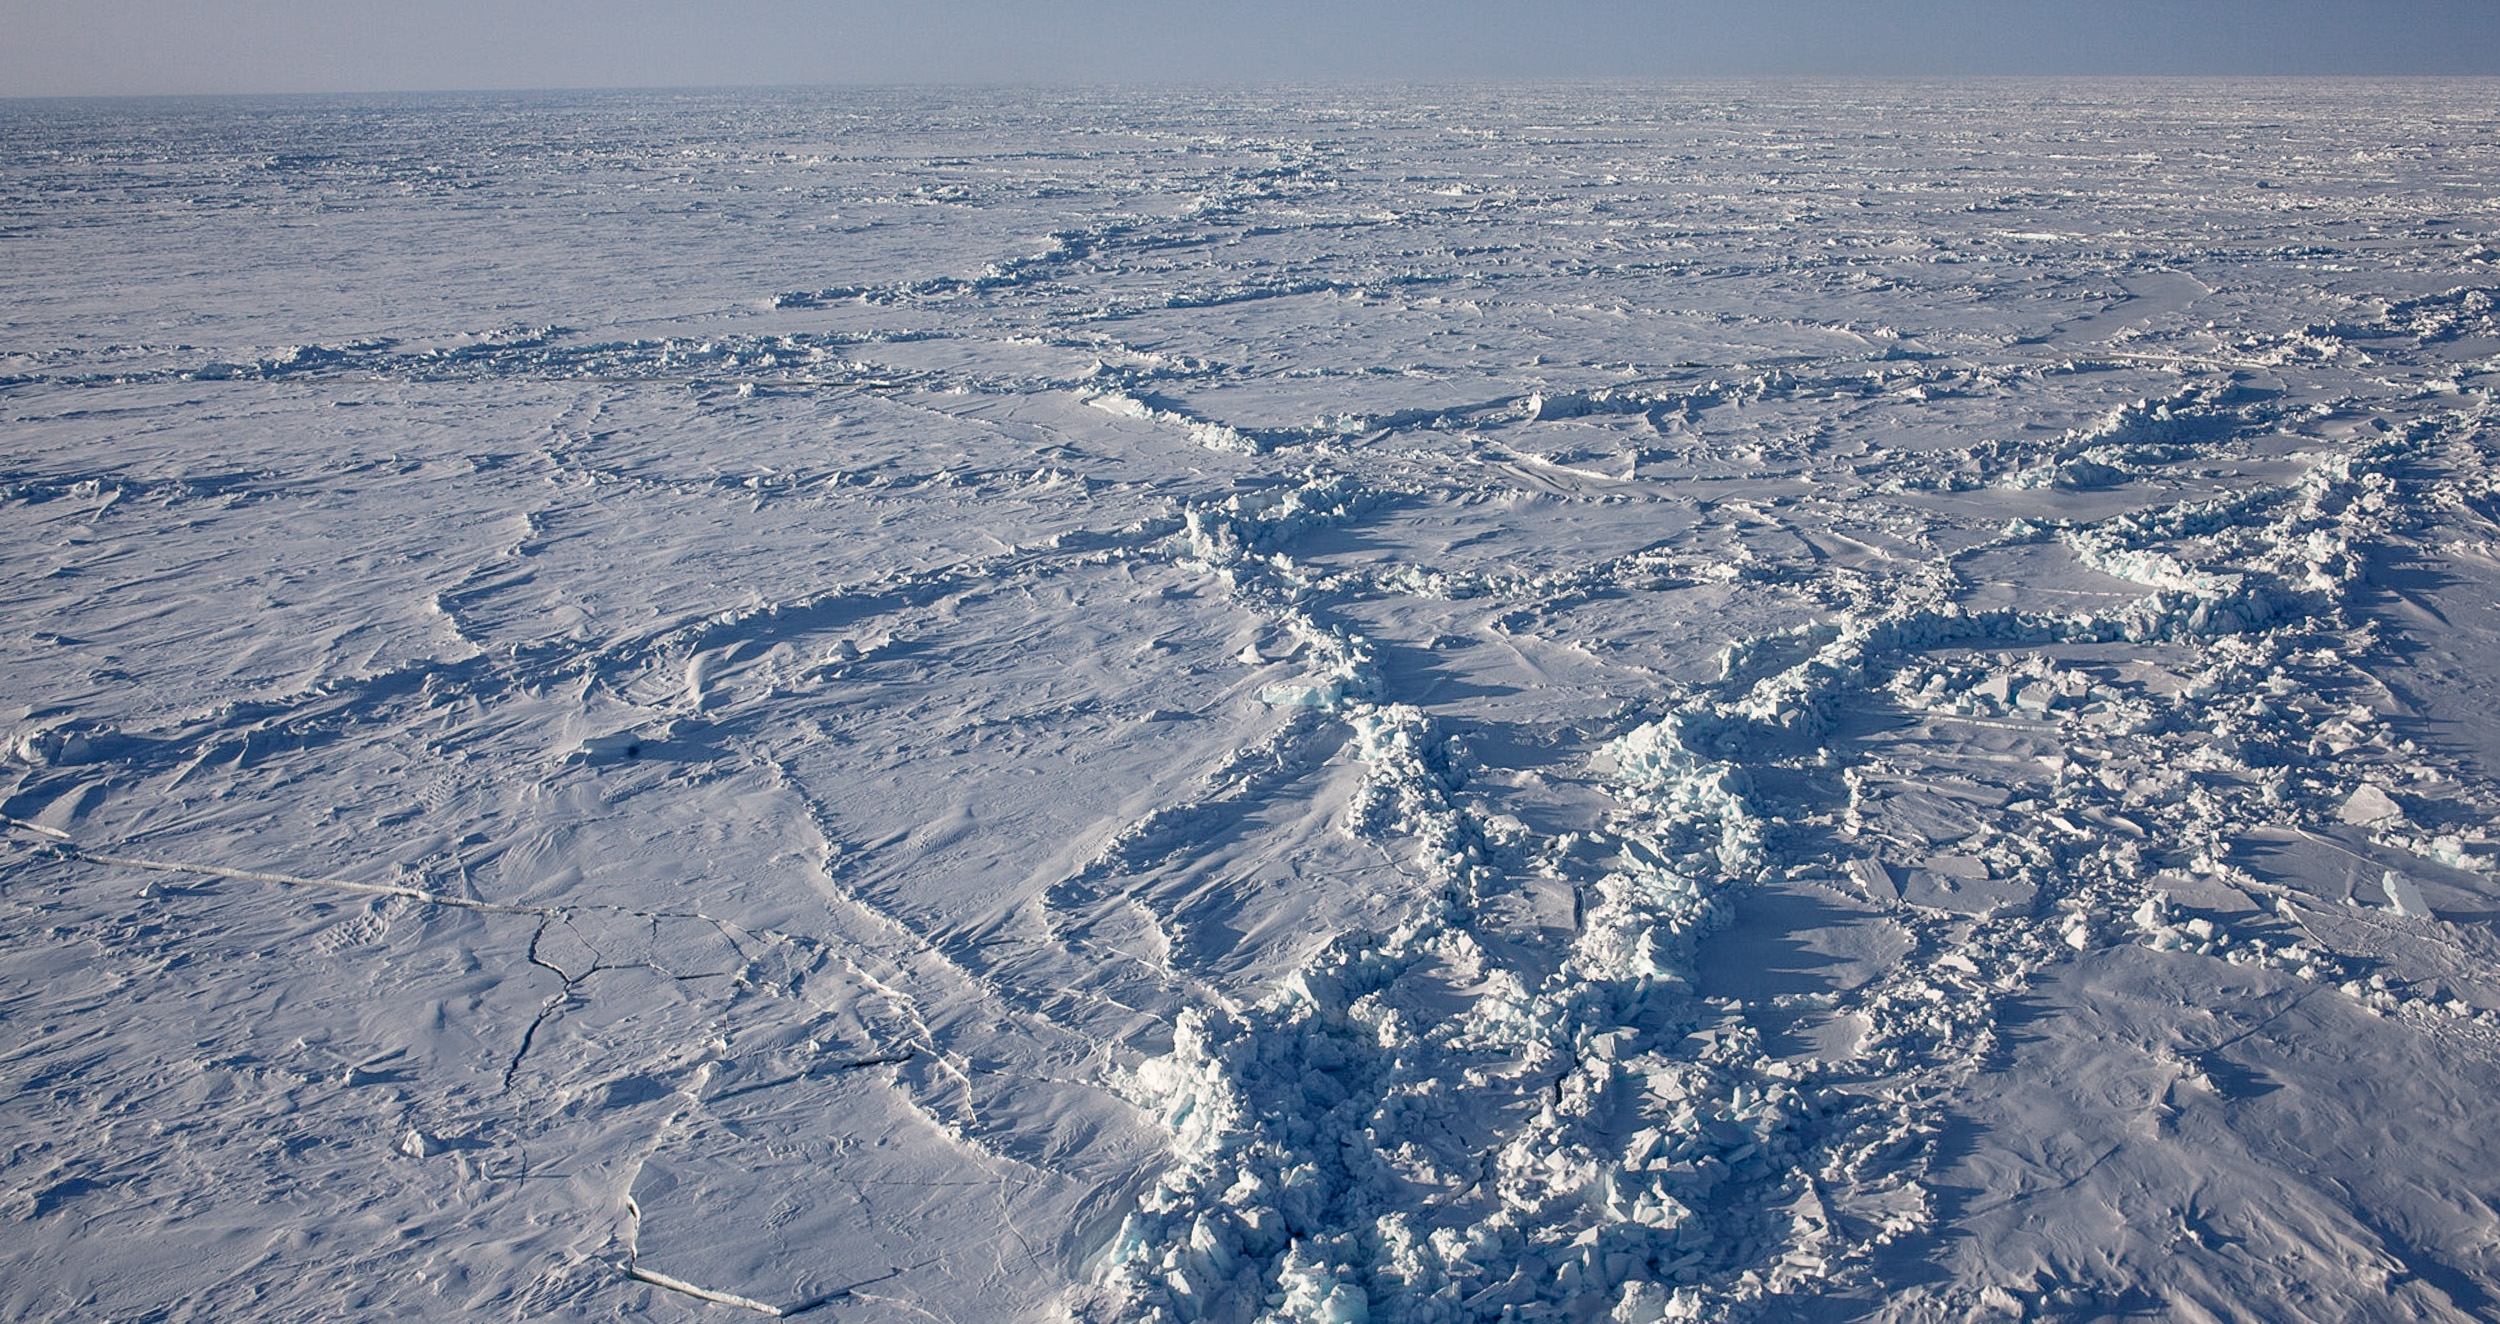
Into unexplored territory in Northern Victoria Land, Antarctic. Photograph from “Journey Into Climate” by ©Paul A. Mayewski and Michael C. Morrison, 2011.
Weather extremes directly connected with climate change in polar regions
Today the Arctic people, scientists and governments realize that the assumed timeless stability of the polar regions is being rapidly disturbed as a consequence of human activity, an invasion of diversities emanating almost solely from elsewhere on the planet.
For the Arctic the invasion comes in many forms such as the:
Warming and sea ice loss
Permafrost degradation
Collapse of coastlines yielding infrastructure disruption and migration from heritage living areas
Ecosystem upheaval resulting from overhunting, resource exploitation and increased human occupation
Ozone depletion resulting in ecosystem exposure to solar radiation
Influx of toxic substances (such as: lead and sulfur from industrial emissions resulting in increased levels of cancer, respiratory and neurological disease, radioactivity from nuclear bomb testing, nuclear waste buildup, and nuclear accidents resulting in significant health issues for humans and ecosystems.)
For the Antarctic, the impacts include:
Pollution from industrial and mining activities in South America and Australia
Ozone depletion
Ecosystem migration
Additionally weather extremes such as drought, floods, storms, heat and cold waves, are increasing in frequency and magnitude outside of the polar regions and a significant proportion of global weather extremes are directly associated with climate change in the polar regions.
Past climate records, developed using Greenland ice cores demonstrate that climate need not change slowly or steadily. In fact, as discovered from our research on past climate, using Greenland ice cores in the 1990s, climate can change abruptly (in less than 1-5 years) under certain conditions. Now one of these conditions – greenhouse gas increase – is higher than anytime in at least the last 800,000 years and has grown at a significantly faster rate as continued warming releases carbon trapped in thawing permafrost ground in the Arctic. And, over the Antarctic there are notable areas of warming, such as the Antarctic Peninsula, floating ice shelves and other coastal zones through southward migration of warm mid-latitude air, and warm ocean currents. Recognizing such potentials for rapid transition in future climate predictions is essential if we are to develop plausible constructions of what is to come.
"The polar regions still offer many surprises and require significantly more scientific investigation. However, they are now clearly known to be changing rapidly, impacting our planet’s health, economy, geopolitics, and quality of life.
The people and ecosystems of the Arctic have been among the first to suffer the results of greenhouse gas warming. They are also among the most affected. This is now causing significant climate instability throughout the Northern Hemisphere.
At the same time, climate change over the Antarctic and the Southern Ocean is altering the distribution of ecosystems and in particular water availability in Australia and South Africa, such as recent shortages in Cape Province. But this only represents the early stages of the polar regions’ response to human intervention in the climate system"
To avoid making more simplifying assumptions about the potential for change in the polar regions and to face the fact that we need to know more about these two opposite ends of the earth, how they are impacted by and impact the rest of our planet, it is a good start to consider some basic similarities and differences that characterize the polar regions. Most important is the fact that the polar regions, are of course, divided into the two most geographically separated regions on our planet.

Figure 1: Arctic sea ice concentration (Gridcell %) using ERA-Interim climate data for the period 1979-2015 (left June-July-August)(JJA), right (December-January-February)(DJF).

Figure 2: Antarctic sea ice concentration (Gridcell %) using ERA-Interim climate data for the period 1979-2015 (left JJA), right (DJF).
The polar regions are vast reflectors and seasonal sea ice is one of the greatest seasonal events on the planet. The Arctic is an ocean fringed by land. The Antarctic, on the other hand, is an ice sheet surrounded by ocean. Arctic sea ice is partially anchored by land, while the Antarctic extends seaward without terra firma anchoring.
This Arctic-Antarctic geographic distinction is an essential element when considering the three basic climate elements that provide important information: surface temperature, atmospheric circulation, and sea ice concentration. There is good reason to focus on these climate elements because understanding and monitoring them provides a window into not only the differences on one hand and the similarities on the other, but as importantly it provides a framework for understanding how much change has occurred in the polar regions in recent decades.
Some initial considerations must be stated before expanding upon the comparison.
We focus here only on recent changes in climate (1979-2015) which we examine using the European Reanalysis Interim (ERA-Interim) climate reanalysis available from the European Centre for Medium-Range Weather Forecasts. ERA-Interim takes irregularly spaced climate observations and recasts them into a 0.75ox0.75o grid space over the world.
To simplify the discussion, the focus is also on annual scale measurements rather than daily-seasonal. It is worth noting, however, that as demonstrated in Figures 1 and 2, for sea ice concentration (% of sea ice covering a grid cell), season-to-season differences are considerable in the polar regions. The December-January-February (DJF) versus June-July-August (JJA) differences in sea ice concentration in the Antarctic are particularly extreme resulting in a near doubling of the whiteness of Antarctica during maximum sea ice extent. In the Arctic sea ice is partially anchored by land masses, while in the Antarctic sea ice extends seaward without landmass anchoring.
"The Greenland ice sheet is approximately 1.7 million km2, 2400 km x 1100 km with a maximum thickness of roughly 3000 m. All of it rests on a continental substrate. If melted completely, it would increase sea level by some seven metres. In contrast, Antarctic ice spreads across 14 million km2 , some 5600 km x 4400 km with a maximum thickness of 4800 m. Melted completely, it would increase sea level by approximately 60m."
Polar regions are giant reflectors for incoming solar radiation
The difference from white snow and ice, to dark ocean surface means, in its extremes, that the most incoming solar radiation is reflected or absorbed, respectively, because of the reflective or absorbing nature of white or dark surfaces. The polar regions are, as stated earlier, giant reflectors for incoming solar radiation and changes in the size and seasonal timing of these reflectors alters the distribution of temperature over the planet and the winds that are driven by these temperature differences.
In addition, when the ocean is covered by sea ice, even the relatively thin 1-3 metres common in the polar regions, heat is trapped in the ocean. Surface circulation is thus slowed by lack of contact with the wind that drives ocean waves. When sea-ice concentration declines, polar oceans release some of their trapped heat ‒ leading to “polar amplification”. This happens in reverse too, so that increased sea ice prevents heat being released from the ocean. Therefore, the polar regions and in particular sea ice, glaciers and floating ice shelves, provide excellent monitors for even slight warming/cooling because of the state change solid-liquid around the freezing point and the amplifying effect of ice covered versus ice free oceans.

Figure 3: Temperature at 2m above the surface (annual oC) using ERA-Interim climate data for the period 1979-2015 (left Arctic), right (Antarctic).
The information used here concerning temperature, focuses on temperature at 2m above the surface. As noted from Figure 3 there is a marked cold core for the Arctic centered over Greenland and one centered over the Antarctic. The coldest near surface temperatures are over the highest portions of the Greenland and Antarctic ice sheets with temperatures at these points of roughly -20˚C and roughly -60˚C, respectively.
The Greenland ice sheet is approximately 1.7 million km2, 2400 km x 1100 km with a maximum thickness of roughly 3000 m. All of it rests on a continental substrate. If melted completely, it would increase sea level by some 7 metres.
In contrast, the Antarctic ice sheet is approximately 14 million km2 , some 5600 km x 4400 km with a maximum thickness of 4800m. Antarctic ice holds around 60% of all freshwater on the planet. If melted completely, it would increase sea level by approximately 60m. The eastern part of the Antarctic ice sheet rests on continental substrate while the western side which faces South America, rests on islands that are depressed below sea level which makes it potentially less stable and more easily floated off - resulting in the potential for relatively rapid ice loss over hundreds of years
Portions of West Antarctica, coastal Greenland and many mountain glaciers melted during the Eemian interglacial, the last naturally warm period lasting 130,000 to 115,000 years ago. Sea levels increased at this time by one to three metres in response to a temperature rise of 1˚C to 2˚C.

Figure 4: Temperature anomaly (difference) at 2m above the surface (annual ˚C) using ERA-Interim climate data. Difference calculated subtracting temperature during the period 1979-1999 from temperature during the period 2000-2015 for the Arctic (left) and the Antarctic (right).
Recent change in temperature over the Arctic and Antarctic appears in Figure 4 above. To demonstrate change in surface temperature we examine the time period 2000-2015 minus, or in comparison to, the period of 1979-1999. Most notable for the Arctic is the up to 4˚C warming over the eastern Arctic.
This is equivalent to a doubling in the length of the summer over this region and it happened in less than 5 years making it the first abrupt climate change of the modern era and also demonstrating that climate need not change linearly. Including the potential for rapid non-linear change in future climate predictions is essential if we are to develop plausible scenarios for future climate.
Future climate change will likely proceed in abrupt jumps in some regions. The release of carbon from frozen ground in the Arctic increases this likelihood. Over the Antarctic there are notable regions of warming including the Antarctic Peninsula, regions of floating ice shelves and other coastal regions. For the comparison period presented here the Southern Ocean has immense regions of surface cooling. This is explained further as we look next at changes in atmospheric circulation.
Scientific discussion of atmospheric circulation can be complex. It can also be approached in many ways, but here we focus on one approach – zonal wind. Wind that runs along lines of latitude, defined as Positive when flowing west to east and Negative flowing east to west, zonal wind is measured in m/second at 850 mbar (approximately 1500m altitude) in the atmosphere.
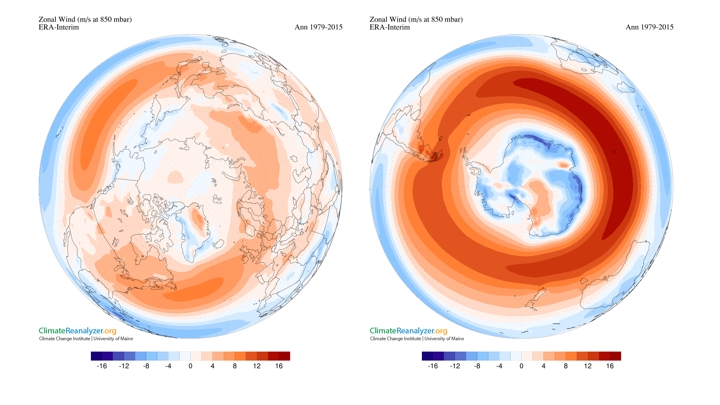
Figure 5: Zonal wind (m/s at 850 mbar) using ERA-Interim climate data for the period 1979-2015 left (Arctic), right (Antarctic).
Zonal winds such as the westerlies (west to east air flow) (Figure 5) are significantly stronger surrounding the Antarctic because, unlike the Arctic, the Southern Hemisphere westerlies flow over the Southern Ocean, with their only continental constriction being the passage between South America and the Antarctic Peninsula. Westerly flowing air masses surrounding the Arctic are slowed and diverted by the continents surrounding the Arctic Ocean.

Figure 6: Zonal wind anomaly (m/s at 850 mbar) using ERA-Interim climate data, plotted using Climate ReanalyzerTM for the period 2000-2015 minus 1979-1999 (left Arctic), right (Antarctic).
Recent change in zonal winds (2000-2015 minus 1979-1999, Figure 6) is significantly associated with temperature change in the atmosphere. Over the Northern Hemisphere, westerly winds have in general weakened, largely in response to warming of the Arctic, resulting in a decrease in the temperature gradient from the Arctic to the mid-latitudes of this hemisphere. Weakening of the Northern Hemisphere westerlies results in a weakening of the barrier between cold air in the Arctic and warm air in the mid-latitudes. This in turn leads to a more embayed pattern of westerly winds with tongues of cold air moving farther south and warm air moving farther north than usual. This is particularly evident by events such as the 30 December 2015 invasion of warm air that resulted in above freezing temperatures at the North Pole (Figure 7) – an occurrence that has been repeated since and will likely be repeated more frequently in the future.

Figure 7: December 30th 2015, example of windspeed (m/s at 250mbar) and temperature at 2 metres above the surface (˚C).
"A major question is what will happen as the ozone hole heals over coming decades while greenhouse gas emissions continue to grow? Will this lead to stronger or weaker zonal winds? If weaker, or displaced even farther south, warm air will penetrate farther inland over the ice sheet creating both increased melting and greater climate instability."
Greater weather instability: It is already clear what is happening
The above mentioned invasion of warm air on December 30th 2015 resulted in above-freezing temperatures at the North Pole (Figure 7). Since then, the same thing has occurred again and will likely occur more frequently in the future. A weakening of this westerly wind barrier leads to more regions where cold and warm air collide, resulting in greater weather instability. This suggests a clear forecast for the Northern Hemisphere if not for global climate: greater instability.
As a result of greenhouse gas warming of the Southern Hemisphere mid-latitudes (Figure 4), westerly winds surrounding the Antarctic have contracted poleward like those in the Arctic, but around the Antarctic they have strengthened rather than weakened. This is related to the temperature difference between the Antarctic and the mid-latitudes. There is some heat loss over the interior plateau associated with the human-induced Antarctic ozone hole because ozone traps some incoming solar radiation. In combination with mid-latitude warming, this steepens the temperature difference, leading to an increase in westerly windspeeds. Cooling of surface waters over vast parts of the Southern Ocean (Figure 4) is a direct response to the rise in these zonal wind speeds that drive away surface waters to be replaced by deeper and colder water upwelling from below.
A major question is what will happen as the ozone hole heals over coming decades while greenhouse gas emissions continue to grow? Will this lead to stronger or weaker zonal winds? If weaker, or displaced even farther south, warm air will penetrate farther inland over the ice sheet creating both increased melting and greater climate instability.

Figure 8: Sea ice concentration anomaly (Gridcel %) using ERA-Interim climate data for the period 2000-2015 minus 1979-1999 (left Arctic), right (Antarctic).
Changes in sea ice concentration (Figure 8) are in direct response to changes in surface temperature and winds. Over the comparison period investigated in this article Arctic sea ice extent has decreased dramatically, due primarily to greenhouse induced warming and the polar amplification associated with this sea ice loss. Around the Antarctic sea ice concentration has both increased and decreased. The decrease is associated with the influx of warmer mid-latitude air and southward migration of warmer ocean currents. The increase is a combination of the buffering effect of strong zonal winds limiting warm air invasion from the north and intensification of shoreward-moving, katabatic, that is gravity driven winds that are intensified by winds driven onto the Antarctic ice sheet, associated with strengthened westerlies, that in turn intensify through their south to north wind component the katabatic winds that push sea ice seaward, opening gaps between breaking sea ice, that freeze and in turn extend sea ice seaward.
Early stages of the polar regions' response to human intervention
The polar regions still offer many surprises and require significantly more scientific investigation, but they are now clearly known to be changing rapidly, impacted by and impacting our planet’s health, economy, geopolitics, and quality of life.
The people and ecosystems of the Arctic have been among the first to feel the results of greenhouse gas warming and certainly among the most impacted. The effects of Arctic warming are being felt in the form of significant climate instability throughout the Northern Hemisphere.
Climate change over the Antarctic and the Southern Ocean is changing the distribution of ecosystems and the availability of water for human consumption in Australia and South Africa. We are only in the early stages of the polar regions’ response to human intervention in the climate system. ▢
Acknowledgements – We thank Dr. Sean Birkel, Climate Change Institute, University of Maine, the developer of the Climate ReanalyzerTM software utilized in all of the graphics in this article.

Dr. Paul Andrew Mayewski is Director & Distinguished Professor of the Climate Change Institute at the University of Maine and a contributing member of the JONAA advisory board. He has led over 55 expeditions to some of the remotest polar and high altitude reaches of the planet, published books on Climate change and Polar science and received numerous honours for his research work in polar regions.